Cover Feature
Articles
News
Search
Cover Feature
Articles
News
Fuel
Fuel
Green Fleet
Green Fleet
Leasing
Leasing
Maintenance
Maintenance
Operations
Operations
Remarketing
Remarketing
Safety
Safety
Telematics
Telematics
Vehicle Research
Vehicle Research
News
Articles
Blogs
Videos
Photo Galleries
Products
Magazine
Statistics
Whitepapers
Job
Directory
Buyer's Guide
Advertise
Meet the Editors
Press Release
Contact Us
Cookie Settings
Marketing Solution
MENU
SEARCH
Statistics
All
Fuel
Green Fleet
Leasing
Maintenance
Operations
Remarketing
Safety
Telematics
Vehicle Research
Home
>
Statistics
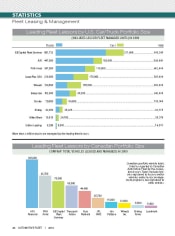
2009 Leading Fleet Lessors
Download
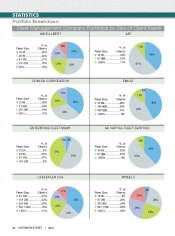
2009 Fleet Size in Lessor Portfolios
Download
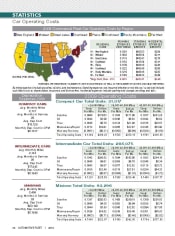
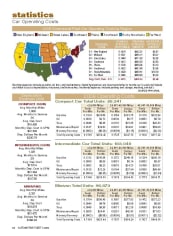
2009 Operating Costs Statistics
Download
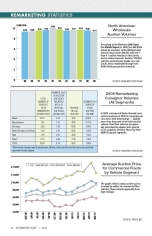
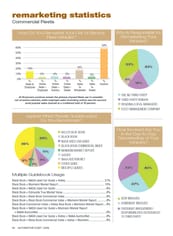
2009 Remarketing Statistics
Download
2009 Maintenance Statistics
Download
2009 Fleet Vehicles by Industry Segment
Download
2008 Fleet Vehicles by Industry Segment
Download
2008 Maintenance Statistics
Download
2008 Remarketing Statistics
Download
2008 Operating Costs Statistics
Download
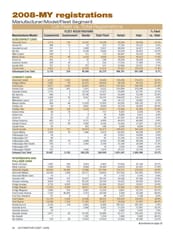
2008-MY Fleet Registrations by Vehicle
Download
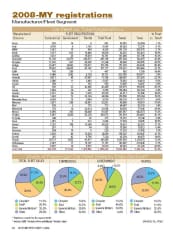
2008-MY Fleet Registrations by Manufacturer
Download
Prev
Next