No safety department? No problem. Here's a practical checklist small fleet managers can use before Operation Safe Driver Week begins.
Read More →
Roadcheck revealed a hard truth: most ELD violations aren't intentional. They're caused by small mistakes that can cost fleets time, money, and trust.
Read More →
Predictive telematics can help small fleets improve driver satisfaction, reduce turnover, and build a stronger safety culture through smarter coaching.
Read More →
Your suppliers can make or break disaster response. Here’s how fleets can reduce vendor risk and keep critical parts flowing when storms hit.
Read More →
How federal disaster declarations work and why fleet leaders should care about funding, reimbursements, infrastructure repairs, and recovery timelines.
Read More →
Tire Science for Fleets: Neil deGrasse Tyson breaks down why the tire contact patch hits 0 mph and what that means for traction and wear.
Read More →
In 2026, AI and embedded telematics will reshape fleet operations. Integration, trust, and responsible AI will separate winners from noise.
Read More →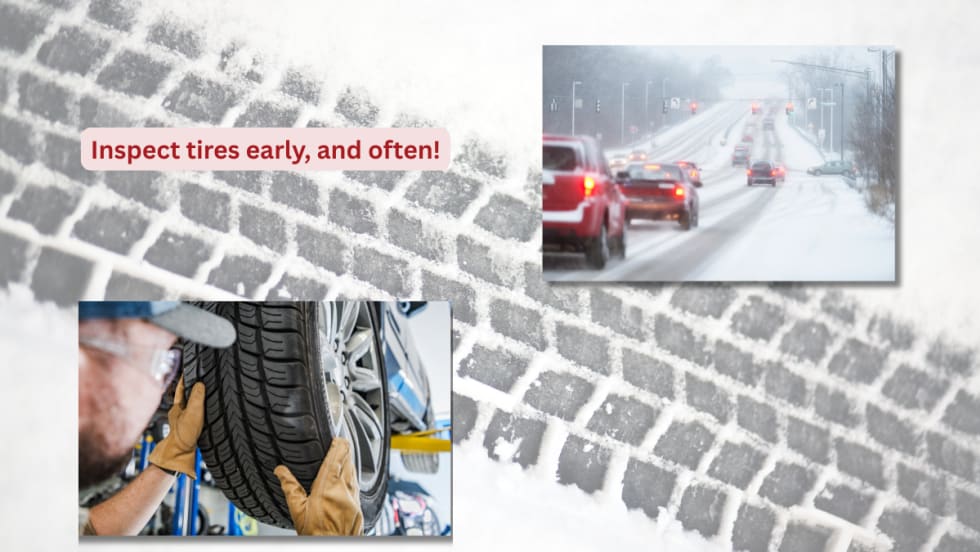
Three fleets share best practices to prep vehicles for winter and prevent downtime when the cold sets in.
Read More →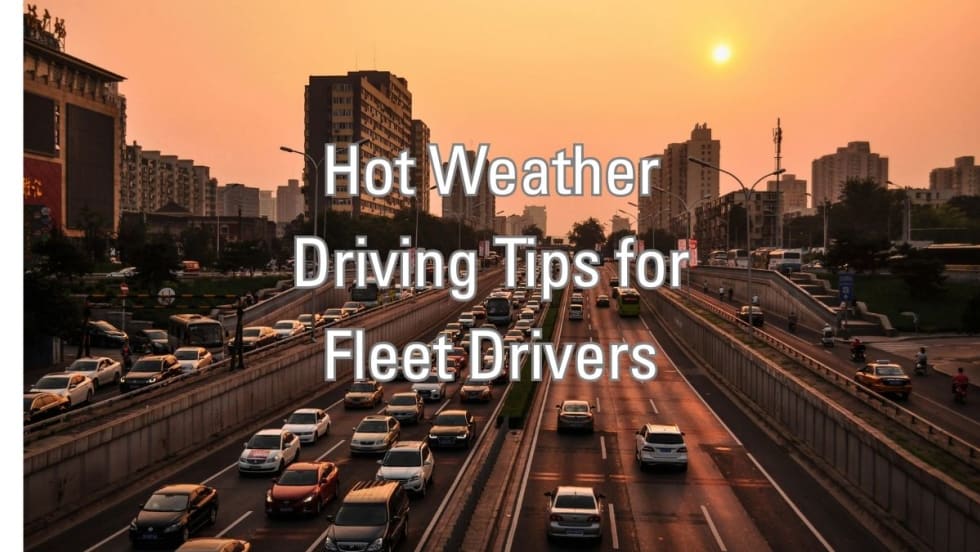
As we head into another potentially extreme summer season, the risks for fleet drivers remain high, from engine strain and tire blowouts to unpredictable traffic patterns. An expert shares advice on how fleet drivers can boost their safety during the steamy summer months.
Read More →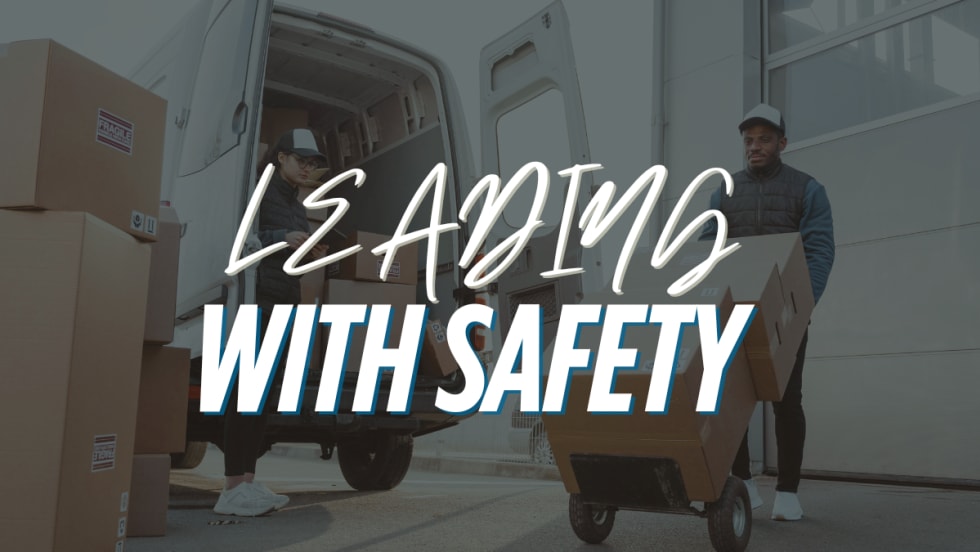
Blending data with day-to-day experience can move safety from policy to practice.
Read More →