


Albuquerque No. 1 in Auto Theft Rate
The latest Hot Spots vehicle theft report from the National Insurance Crime Bureau also reveals that Anchorage, Alaska and Billings, Mont. are newcomers to the top 10 list.


Photo: Bobit
The greater Albuquerque, N.M. metropolitan area had the highest per-capital auto theft rate in 2016, according to a new report from the National Insurance Crime Bureau (NICB).
In 2015, Albuquerque ranked second, behind Modesto, Calif., in auto theft rate. Last year, six of the top 10 metropolitan statistical areas in vehicle theft rate were in California.
Hot Spots, a report that NICB releases annually, examines vehicle theft data collected by the National Crime Information Center for each of the nation’s metropolitan statistical areas. These statistical areas, designated by the Office of Management and Budget, often include population centers much larger than the cities for which they’re named. For example, the Albuquerque metropolitan statistical area includes the entire county of Bernalillo, not just the area within Albuquerque city limits.
New to the top 10 this year is Anchorage, Alaska (No. 6) and Billings, Mont. (No. 10). As a population-based survey, an area with a much smaller population and a moderate number of thefts can — and often does — have a higher theft rate than an area with a much more significant vehicle theft problem and a larger population to absorb it, NICB explained. This is how Billings, with 877 auto thefts, placed 10th while Los Angeles, with 60,670 thefts, placed 35th.
For 2016, the 10 metropolitan statistical areas with the highest vehicle theft rates were:
Albuquerque, N.M. (10,011 thefts in 2016, up from 6,657 in 2015)
Pueblo, Colo. (1,325 thefts in 2016, up from 983 in 2015)
Bakersfield, Calif. (7,176 thefts in 2016, up from 6,000 in 2015)
Modesto, Calif. (3,820 thefts in 2016, down from 4,072 in 2015)
Riverside-San Bernardino-Ontario, Calif. (25,708 in 2016, up from 25,001 in 2015)
Anchorage, Alaska (2,273 in 2016, up from 1,359 in 2015)
Merced, Calif. (1,605 in 2016, up from 1,132 in 2015)
San Francisco-Oakland-Hayward, Calif. (29,414 in 2016, down from 30,554 in 2015)
Fresno, Calif. (5,682 in 2016, up from 5,149 in 2015)
Billings, Mont. (877 in 2016, up from 775 in 2015)
To learn how your area ranks, click here.
Each year, the FBI releases preliminary Uniform Crime Report data for the previous year’s January-June time frame. When the preliminary 2016 crime data was released earlier this year, vehicle theft was up 6.6% across the nation. This increase is reflected in the Hot Spots report and is expected to hold when the final data is published in the fall, NICB said.
For comparison, below is a table showing the preliminary Uniform Crime Report vehicle theft data, the percent change from the previous year, and the final Uniform Crime Report vehicle theft figure:
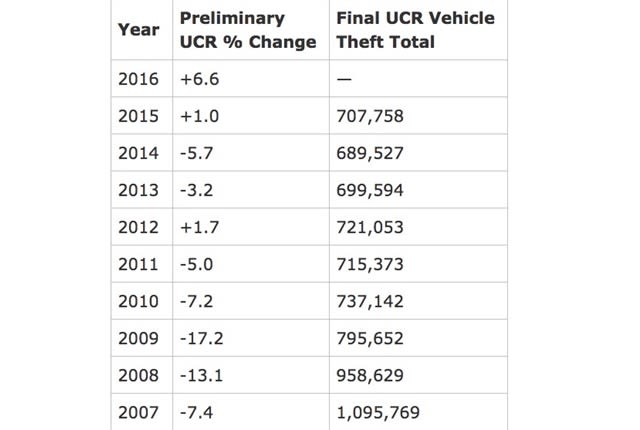
Source: NICB
The historic peak year for vehicle theft was 1991, when there were more than 1.6 million reported thefts. In 2015, the total was 707,758 — a 57.4% reduction since 1991.
"While the final result for 2016 is expected to be higher than 2015's number, the vehicle theft environment across the country is vastly improved from the 1990s," NICB said in the organization's released statement about the Hot Spots report.
Originally posted on Automotive Fleet
More Safety

Mercedes Benz Tests CLA Occupant and Battery Protection in Side Impact Crash
Two CLA sedans traveling at 35 mph were used in a Mercedes-Benz crash test examining occupant protection and electric vehicle battery safety.
Read More →
How Technology Can Help Fleet Owners Improve Insurability
Your fleet's telematics data could be the difference between getting insurance coverage and facing higher premiums or non-renewal. Here's what insurers are looking for and how fleets can use that data to make a stronger case at renewal.
Read More →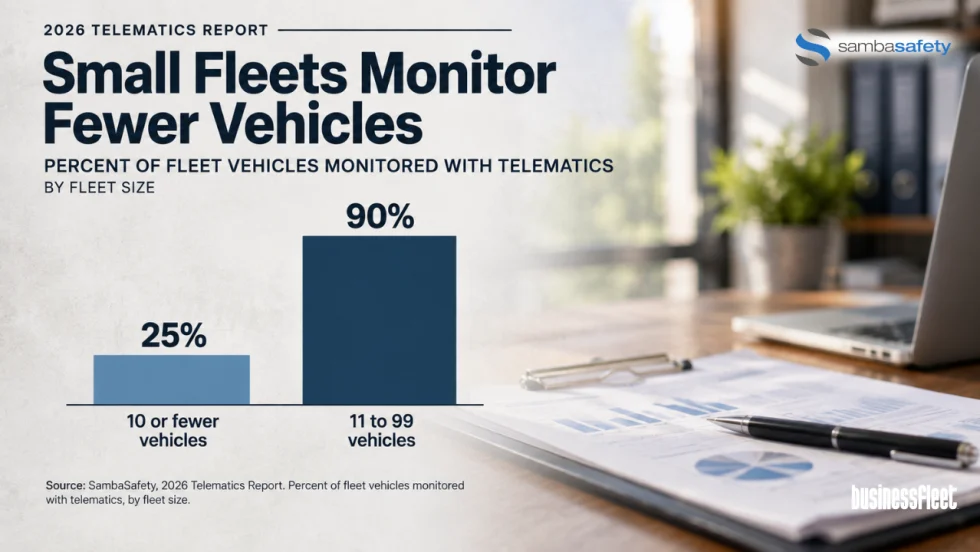
Small Fleets Lag in Telematics Coverage as Industry Moves Beyond Adoption
SambaSafety’s 2026 Telematics Report finds fleets with 10 or fewer vehicles monitor a much smaller share of their vehicles than larger operations, as the industry shifts its focus from collecting data to using it.
Read More →
Back-to-School Traffic Is Not the Risk Fleets Think It Is
Back-to-school traffic does not always mean more crashes. New Empiric Earth data shows why fleets should focus on when and where risk changes.
Read More →
Small Fleet, Big Exposure: How to Reduce Workers’ Comp Risks
For small fleets, one crash can trigger far more than vehicle damage. Here’s how stronger driver safety policies, training, maintenance, and technology can help reduce workers’ comp exposure.
Read More →
Who Makes the Call When Winter Weather Gets Dangerous?
Winter weather can quickly change a small fleet’s plans. Knowing when to reroute, delay, or stop can matter just as much as preparing the vehicles themselves.
Read More →
API Issues Refueling Safety Guidelines
The American Petroleum Institute offers a list of safe vehicle refueling guidelines, including ways to avoid potential problems with static electricity discharges in fall, winter, and early spring.
Read More →
Winter Fleet Prep: Expert Tips to Keep Vehicles Running Smoothly
Cold weather can expose weak batteries, tires, fuel systems, and maintenance gaps fast. Use this winter fleet checklist to prepare trucks and drivers before temperatures drop.
Read More →
8 ADAS Maintenance Tips for Small Business Fleets From Bendix
A dirty camera, bad alignment, or one loose connection could quietly knock your fleet’s ADAS offline. Here’s what Bendix says to check.
Read More →
Developing Budget-Friendly Driver Safety Programs
From driver training and safety meetings to one-on-one coaching and incentive programs, several small fleets share how they have developed a safety culture with their drivers using low- to no-cost resources.
Read More →